Do you know what your application is doing? Is it happily crunching along or is it slowly getting consumed in a blazing ball of fire? In the age of services, not every application has a UI to show you the screen of death. How is your application being used? Are you missing opportunities or is traffic so slow that it's best to shut it down before you get your cloud bill?
These are all questions we try to solve by introducing logging into our applications. Web requests are being logged by the web server, business events are sent to records in the database and OS level information is pushed to the event log.
But every layer in our technology stack often introduces a new format of logs. Our applications are scaled over many micro-services and balanced over many servers. Sometimes the logs are inaccessible due to security restrictions. Trying to make sense of this mess is the domain of operational intelligence.
The tools
Of course there are tools that solve this problem for us. They pick up the data where we tell it to look. They extract the data we need and present it in the format we like.
I myself am a big fan of Splunk. It does exactly what it says on the box and a lot more. But it is a commercial solution and although it starts out pretty cheap, the price can quickly rise to tens of thousands of euros when ramping up your data collection. So I decided to give the ELK stack (Elasticsearch, Logstash and Kibana) a spin.
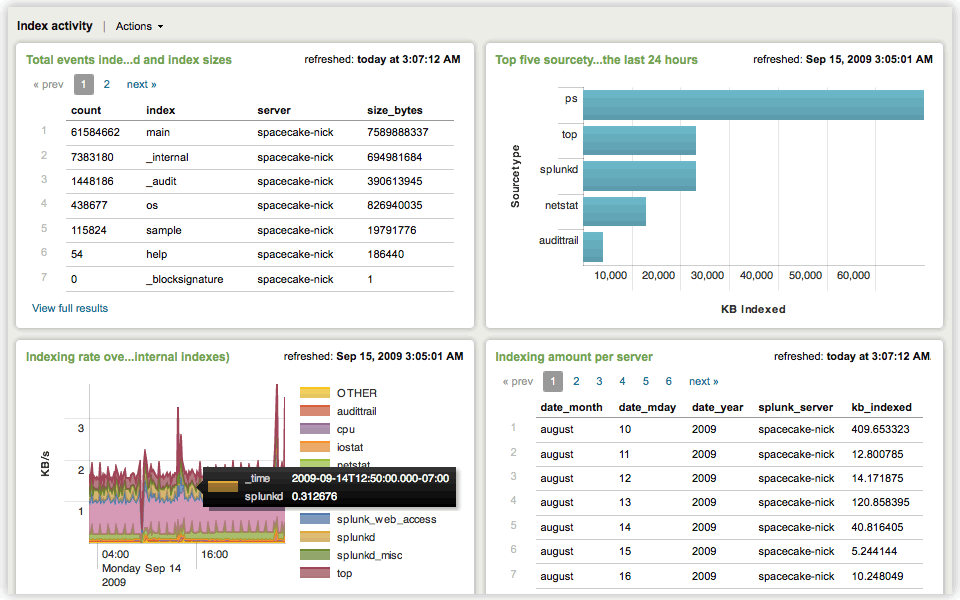 Splunk
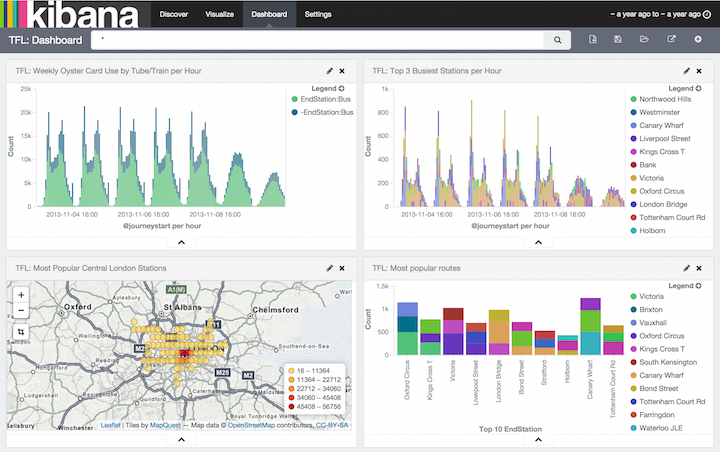 Kibana
The test
At a client where I set up Splunk, I made it listen to syslog events over TCP sent by the application to capture business events. I extended this setup to collect IIS log files from the web server. That's also exactly what I tried to set up with ELK.
The result
I'm happy to announce that both tools managed to get the job done. Splunk took a little less time because it has the most out-of-the-box features. Let's look at some of the test results.
Configuration
Configuring the indexation of the IIS logs took seconds in Splunk, for ELK I had to plow through the internet looking for a configuration conforming to my log structure. Apparently there is also a difference between a real IIS Server and my IIS Express. Splunk didn't make any fuss about this, but for ELK I had to delve deep into the dark recesses of regular expressions to overcome this difference.
For the syslog endpoint I'd say both tools performed the same, since I had to configure Splunk as well to get it to parse my logs the way I want. (Yes, RFC5424 is correct and contains the epic lines: "This document obsoletes RFC 3164" and "March 2009"). So for both tools you can't shy away from getting your hands dirty and covered in regular expressions.
One particular problem with ELK is the fact that you are working with 3 different products. They are a good match, but it means Logstash (the crawler) needs to get the data in Elasticsearch (the indexer) in the right format, so Kibana (the UI) can make sense of it. I had to suffer through a few crashes because this wasn't the case.
Data exploration
In both tools you can click your way through your logs. You start out broad and steadily narrow down your search, until you find what you're looking for.

What ELK does exceptionally well, is applying a filter to an entire dashboard. This allows you to get a view on your data at-a-glance and then drill down to get more and more detail. Splunk does this too, but to really correlate different views on your dashboard, you need to configure this explicitly in XML. For Elk, this is the default behavior.
Where Splunk really shines is dynamic data exploration. Splunk will just find and extract everything as a searchable field when it is formatted in a "key=value" way. Particularly for syslog this is a real treat, since all custom data is formatted this way. This allows your applications to log fields that haven't even been configured in Splunk and still search for them. You can also teach Splunk a pattern in your data with a nice wizard (basically a regex wizard). That way it can extract interesting pieces of information on the fly. ELK needs to know about every field in advance. The full text search will still find some of it, but good luck trying things like 'greater than' and aggregations.
Alerts
Alerting, as in not watching a dashboard but being notified, is something I couldn't find in ELK, no matter how hard I tried.
That is THE feature in Splunk. Setting up an alarm is as easy as looking for what is an anomaly to you and saving that as an alarm. Then you can just configure the time frame and actions to perform.
The verdict
Which tool is the right one for you? That will depend on your expectations.
- Do you lack the in-house skills to set up a solution and you want a "data playground"? Then Splunk will be right up your alley thanks to its dynamic nature.
- If you're looking for a tool that allows detailed post-mortem analysis, ELK may perform better due to its somewhat more powerful dashboards.
- If it's active monitoring you're after, Splunk is the way to go.
- Splunk can also literally be deployed and configured by your grandmother.
Conclusion
In the end, it's a comparison between an open source and a paying solution. The thing to remember though is that open source doesn't mean free. You decrease the cost of ownership, but increase the cost of deployment, maintenance and support. An open source solution will often result in a mash-up of different products, which increases the overall complexity and learning curve.

If you are only looking for insight into your logs, definitely go for ELK. The more features you need, the faster Splunk will outpace your mash-up based on ELK in the long run.