In a big data world, data-driven decisions and Internet of Things, Analytics is often needed to acquire data insights. However, when data scientists forget to use visualizations to communicate or explore information they are missing out on a valuable tool.
/social-suggested-images/datavisualizationtips_hdr.jpg?width=599&height=336&name=datavisualizationtips_hdr.jpg)
While analytics algorithms can be used to analyze information, derive new insights and predict future events, visualizations can be used as an aid in every step of that process.
They can be used to analyze data, show higher-level information, visually interpolate data, relate data, show the prediction accuracy or the most important properties in a prediction. Whereas the algorithm provides us with the facts, the visualization aids us to understand the facts, the results and conveys a story.
By using the right visualization tailored for a client's business, we can provide insights to the organization's decision makers on both the data as on the results from data analytics.
How to design a visualization?
When you create visualizations you often run into one of the following questions:
- Which chart or combination of charts should I use? And how should I decide it?
- Should it be interactive?
- Do I need an exploratory visualization or an explanatory?
- Do I show all the data at once or allow the user to drill down?
- Should I use animations or is that distracting?
However, there is no correct answer as it depends on the kind of data, the size of the data, the available tools and the media on which it will be represented. But most importantly, it starts with asking yourself: What is my target audience and what do I want to achieve?
It's not surprising that this is the same question you ask yourself when you are wondering how to communicate effectively. Instead of starting from scratch, there's a number of guidelines and common practices to fall back on to avoid some of the pitfalls typically encountered. In this post, we'll list some of them to help you design a visualization that meets your goal.
Explanatory vs exploratory visualizations
There are typically two major types of visualizations: the ones that provide insights and tell a story are often of the explanatory type, while tools that provide interactions to browse through the data and drill down are called exploratory visualizations. The second kind allows us to stumble on peculiarities in the data which we might not have noticed before, because we did not know what we were looking for yet. Below we can see three common pitfalls when making data-driven decisions and show how different visualizations can prevent them.
1. Making assumptions based on an incomplete data view
An example of this problem is the famous Anscombe's quartet. It contains four data sets that look similar based on statistical properties but when graphed are completely different. As you can see, a simple visualization provides us with much more insight in the data. The combination of these four simple graphs can be seen as an explanatory visualization since it explain us why it's dangerous to make assumptions on statistical properties.

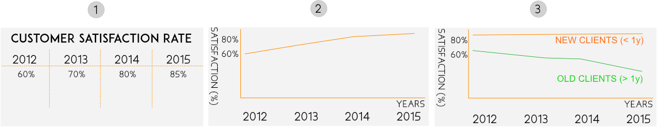
2. Using a visualization that provides an incomplete view of the current data
Visualizations can solve the above problem but can also be incomplete. Consider the three images below where we start with a spreadsheet report that shows us that our customer satisfaction rate is improving.
Visualizing this data as we did in image 2 below does not help us to understand why the rate is improving but, it does make it easier to see the evolution.
However, adapting the visualization and splitting new clients (< 1y) and old clients (> 1y) in two separate lines shows that this conclusion may have been wrong. Our new clients are generally happy, but the ones that have been with us for a year are unhappy. And lately we seem to be doing a worse job at keeping them happy.
By choosing a good combination of graphs we could find an explanation. For example, this particular situation could be explained by the two graphs in the image below.
When the number of new clients each year is going up significantly (shown in the bar charts of the lower graph) and those new clients are generally more satisfied, it will bias the total satisfaction results. This shows that the combination of graphs is equally important as the selection of the correct graph.
The below example is also an explanatory graph since it's designed to interpret this specific case.

3. Not taking into account how data changes over time
When a company sees this result and takes action, the above visualization might not be relevant anymore. In case the satisfaction of the clients starts to go down after five years instead of one, we would again get an incomplete view to draw our conclusions.
This is where exploratory visualizations can be useful. With these types of visualizations, the designer does not decide for the user what values for particular parameters have to be chosen. Often the user can control which part of the data he wants to investigate and how he wants to investigate it.
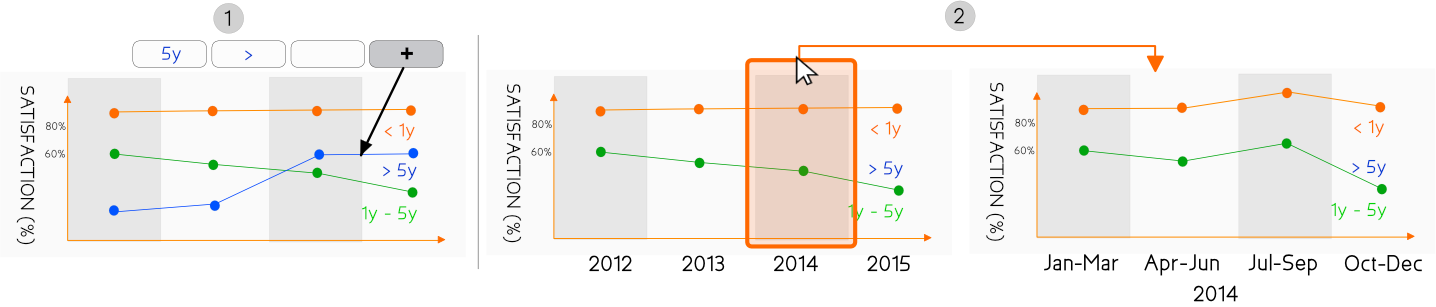
Going back to the previous example, we could allow them to add as many plots on the graph as desired such as in the image below on the left (1). Or we could allow them to zoom in on a certain area of the graph to see whether a certain event at a certain month had an impact on the client satisfaction (2).
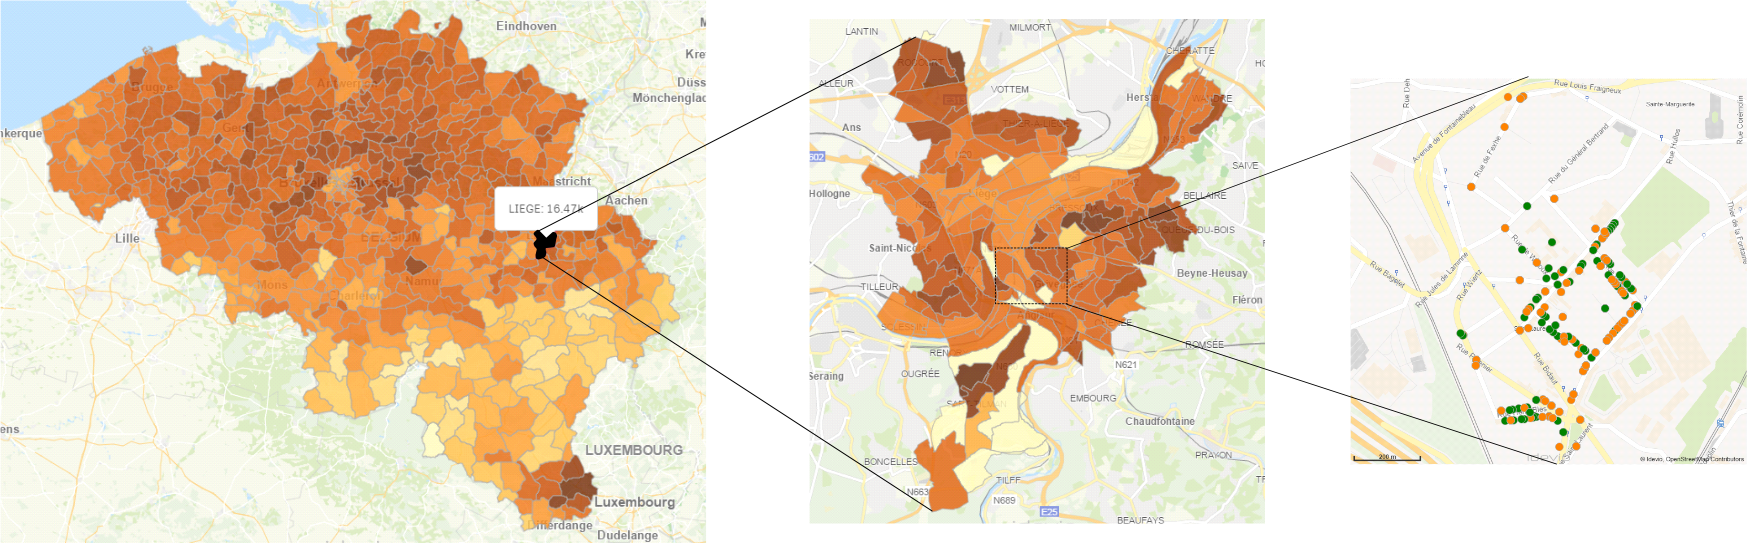
Other good examples of exploratory visualizations are geographical heatmaps or dotmaps such as the Social explorer US elections map. Also fitting the bill is the example below which AE helped realize for one of its customers. These often include filters to select a specific data set, allow zooming to investigate data in more detail (three zoom levels are depicted below) and provide interactions with individual data points to get more information.
The user can browse around and draw his own conclusions from the visualization, e.g. he might zoom in because he's only interested in a specific state where he lives or he can drag around the map to find a state which has exceptional results.

Ideas to guide your thinking process
Aim for the sweet spot
David McCandless created a chart that shows which key ingredients are required for a successful visualization. In short, one should aim for a combination of correct information, story, goal and visual form. If one of these four ingredients is missing, your visualization risks to be ignored.
For example, if there are data integrity problems the visualization is not useful to draw conclusions yet. But if it's not visually appealing, users might consider it to be boring and decide not to use it.

Choosing dimensions
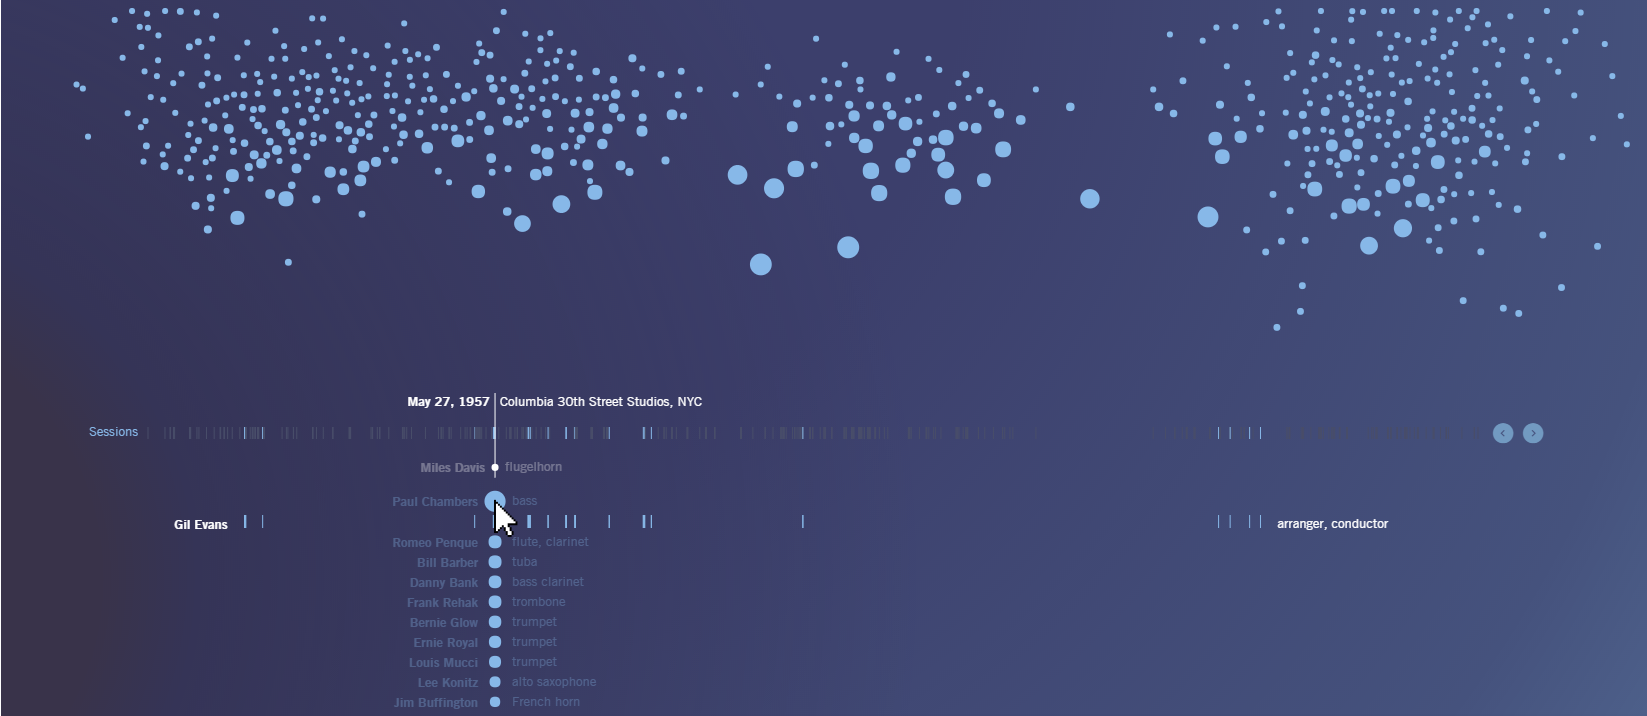
Nowadays we also see a lot of very impressive and engaging visualizations such as the Scaled in Miles visualization which goes beyond the typical choice of charts. Here they chose to write something completely custom and allow the user to explore. For a certain musician it answers questions such as: "how much did he contribute to Miles Davis's music compared to others and at which timeframes did he work with him?". These kind of questions would be difficult to answer using a standard chart.
Besides of the question it answers, Scaled in Miles is considered to be an engaging and beautiful visualization which is extremely important for marketing purposes. But how do we start with such a visualization?
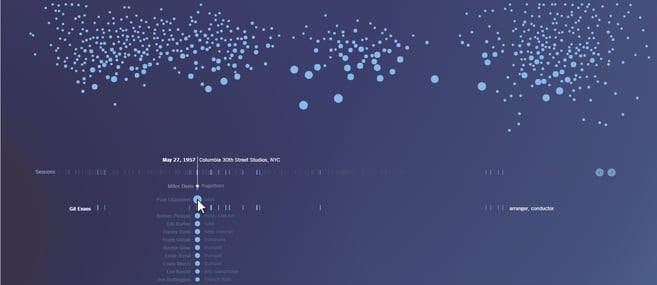
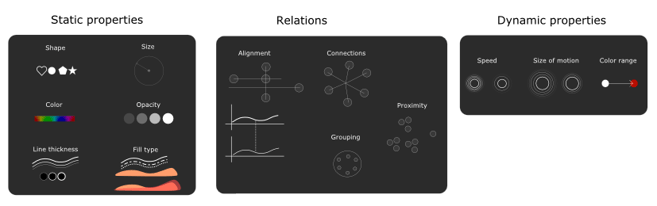
The answer is to list all the available visual features (dimensions) at your disposal and incrementally select one for each requirement. Dimensions are all the different visual possibilities that are at your disposal that can help you to better visualize your data.
For example, in the Miles Davis case, each musician is represented by a dot (shape dimension) while the sessions that he played together with Miles are shown with small vertical lines.
The size (size dimension) of a dot indicates how much he played with Miles. Besides of these properties they also use relations, e.g. they visually align (alignment dimension) the dots according to the time when they played with Miles.
Some properties can be animated in which case we can use dynamic dimensions. For example, they use opacity (opacity dimension) to highlight the sessions in which the selected musician has played. To clarify interaction when clicking on a musician, they slowly fade out the sessions in which he did not contribute.
When choosing dimensions, it is imperative to realize that people will associate certain properties with certain meanings. For example, shapes are often used to categorize while a bigger size and higher opacity often indicates the importance of an object. In a security dashboard which shows warnings, a warning that has a very fast pulsating animation (speed dimension) could indicate a higher degree of danger.
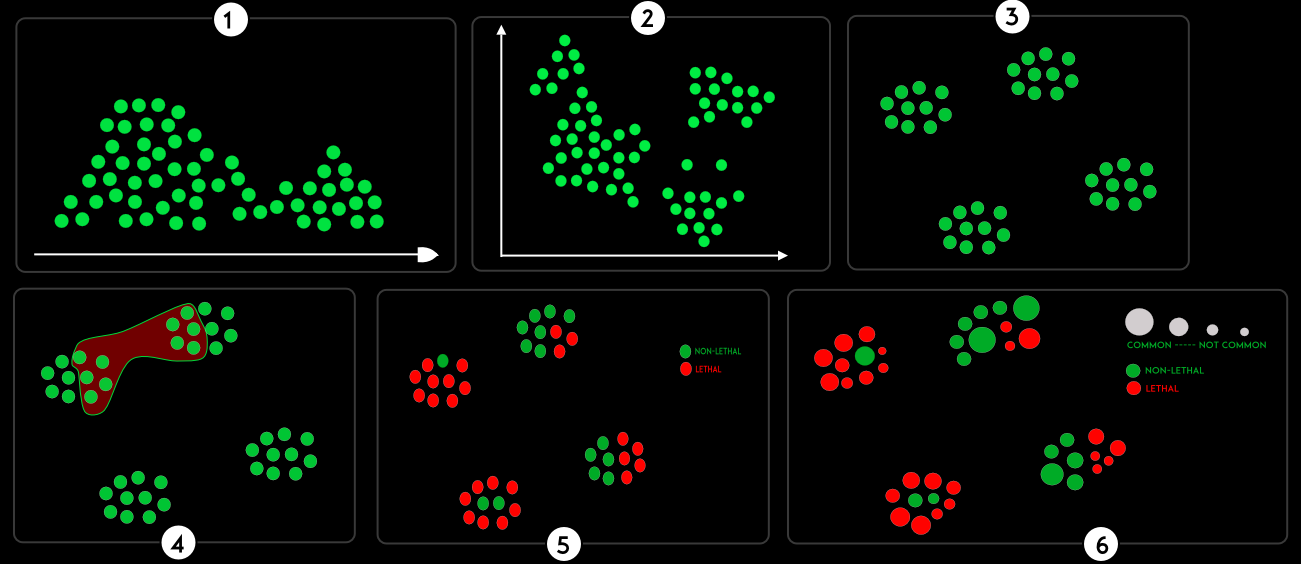
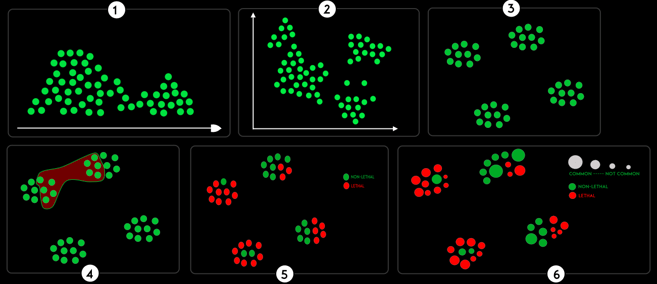
Imagine you need to write a visualization on diseases. The process could go as follows:
(1) You decide that Mortality is the most important property of the disease in the context of this project. So you choose to align all diseases on an axis based on this property, as shown in figure 1 below.
(2) Then "the negative effect on life quality" might be equally important since diseases that reduce the patient's life quality to zero might be equally important as a mortal disease. You might decide to use a second axis which brings you to a typical scatterplot (align) as shown in figure 2.
(3) Then it appears that the category of the disease is a more important stakeholder in which case the clustering (proximity) that is used in figure 3 might be used to separate each disease per category.
(4) To highlight a secondary relation (e.g. a similar host) of the diseases could then be done by grouping them in the same container like in figure 4.
(5) Since we are still interested in how lethal a disease is but can't use alignment (that would conflict with the clustering) anymore we opted for colors in figure 5.
(6) Finally, the main interest appears to be with diseases which are common so we could use size to highlight the more common diseases. As a result we can see in figure 6 which category holds the most diseases that are both common and lethal.
Interactivity and Feedback
One last ingredient that makes a great difference is to add interactivity and provide great feedback. To learn how to provide feedback or use interactivity, you first have to realize the impact of both. We will not go into this here since Bret Victor already makes an excellent point how feedback helps the user to explore in his 'Inventing on the principle' talk and explains how to use interactivity to drill down in data in his Ladder of Abstraction approach.
The higher level process: how to come up with a new visualization?
We look at designing a good visualization as a process of three overlapping steps. The first step is to know your goal and target audience by talking to the business and understanding the business context. With that goal in mind, proceed to the second step and make yourself familiar with the data.
Keeping the goal in mind while looking at the data helps to come up with creative ideas. Once you know the data, think of the possible dimensions that you could use both on a lower level (colors, shapes) as on a medium level (graphs) and highest level (combinations of graphs and layout).
During this process, new possibilities or possible goals might come to your attention. Therefore it is imperative that this process is revisited and presented to the business stakeholder, especially if the goal is very general and there are still many questions about the data.
The new data insights that are derived from an intermediate version of the visualization might make us realize that we can do much better than the defined goal (new ideas pop up when viewing the visualization) or that some of the goal questions cannot be answered due to data quality issues. Or we might have made assumptions about the data and can now see that the visualization we have chosen is not ideal.
Ideally, we use visualization libraries and tools (R packages, Shiny, Tableau, cartodb, JavaScript libraries, ...) to quickly build a proof of concept and only build a custom version for the final visualization once we've finalized what it will look like and know that custom development will have added value.

Data visualization at AE
We have shown several ways to think about visualizations and principles to keep in mind when designing them. You can find great examples of these principles on the web. At AE we have also built up quite experience in a wide range of visualization types and technologies to build them.
We have built both completely custom visualizations as well as out of the box visualizations with tools such as cartodb, Tableau or semi-custom development with R plotting packages and Shiny.
Here are a few examples of visualizations to which AE has contributed:
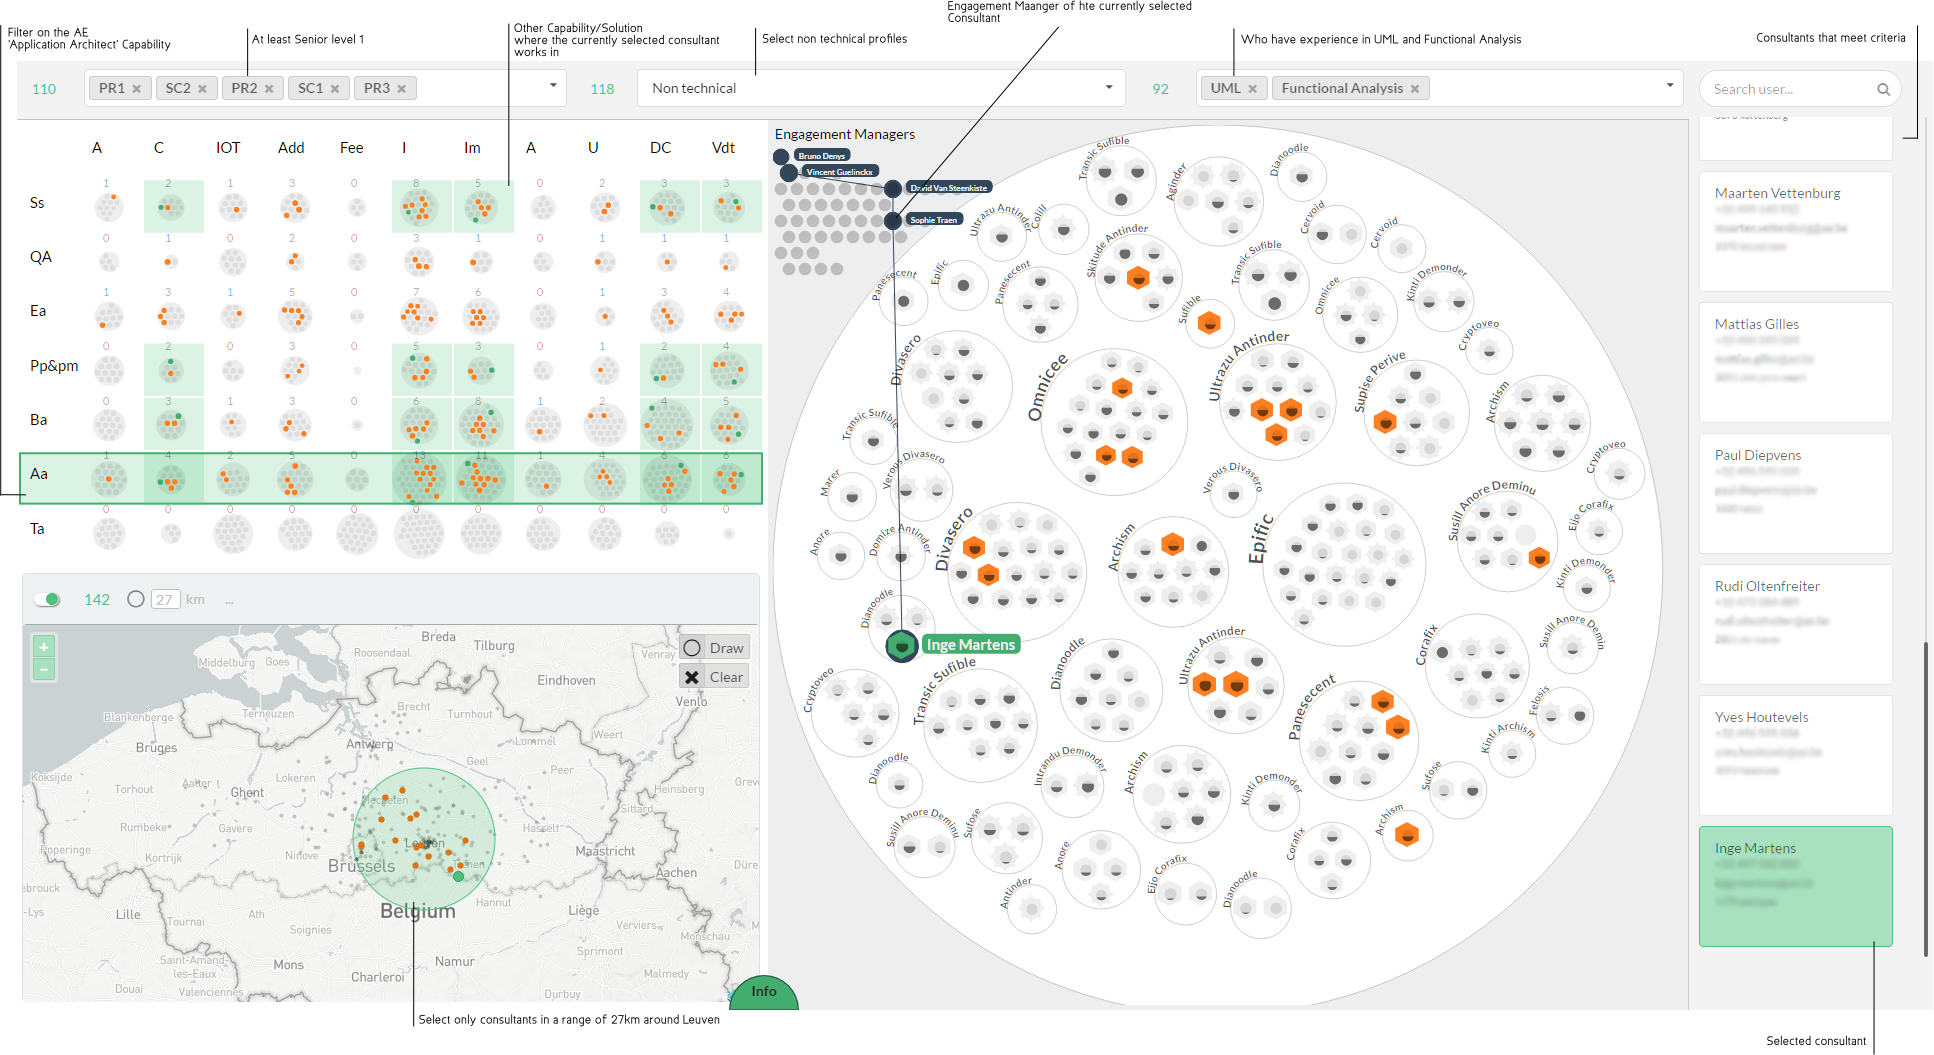
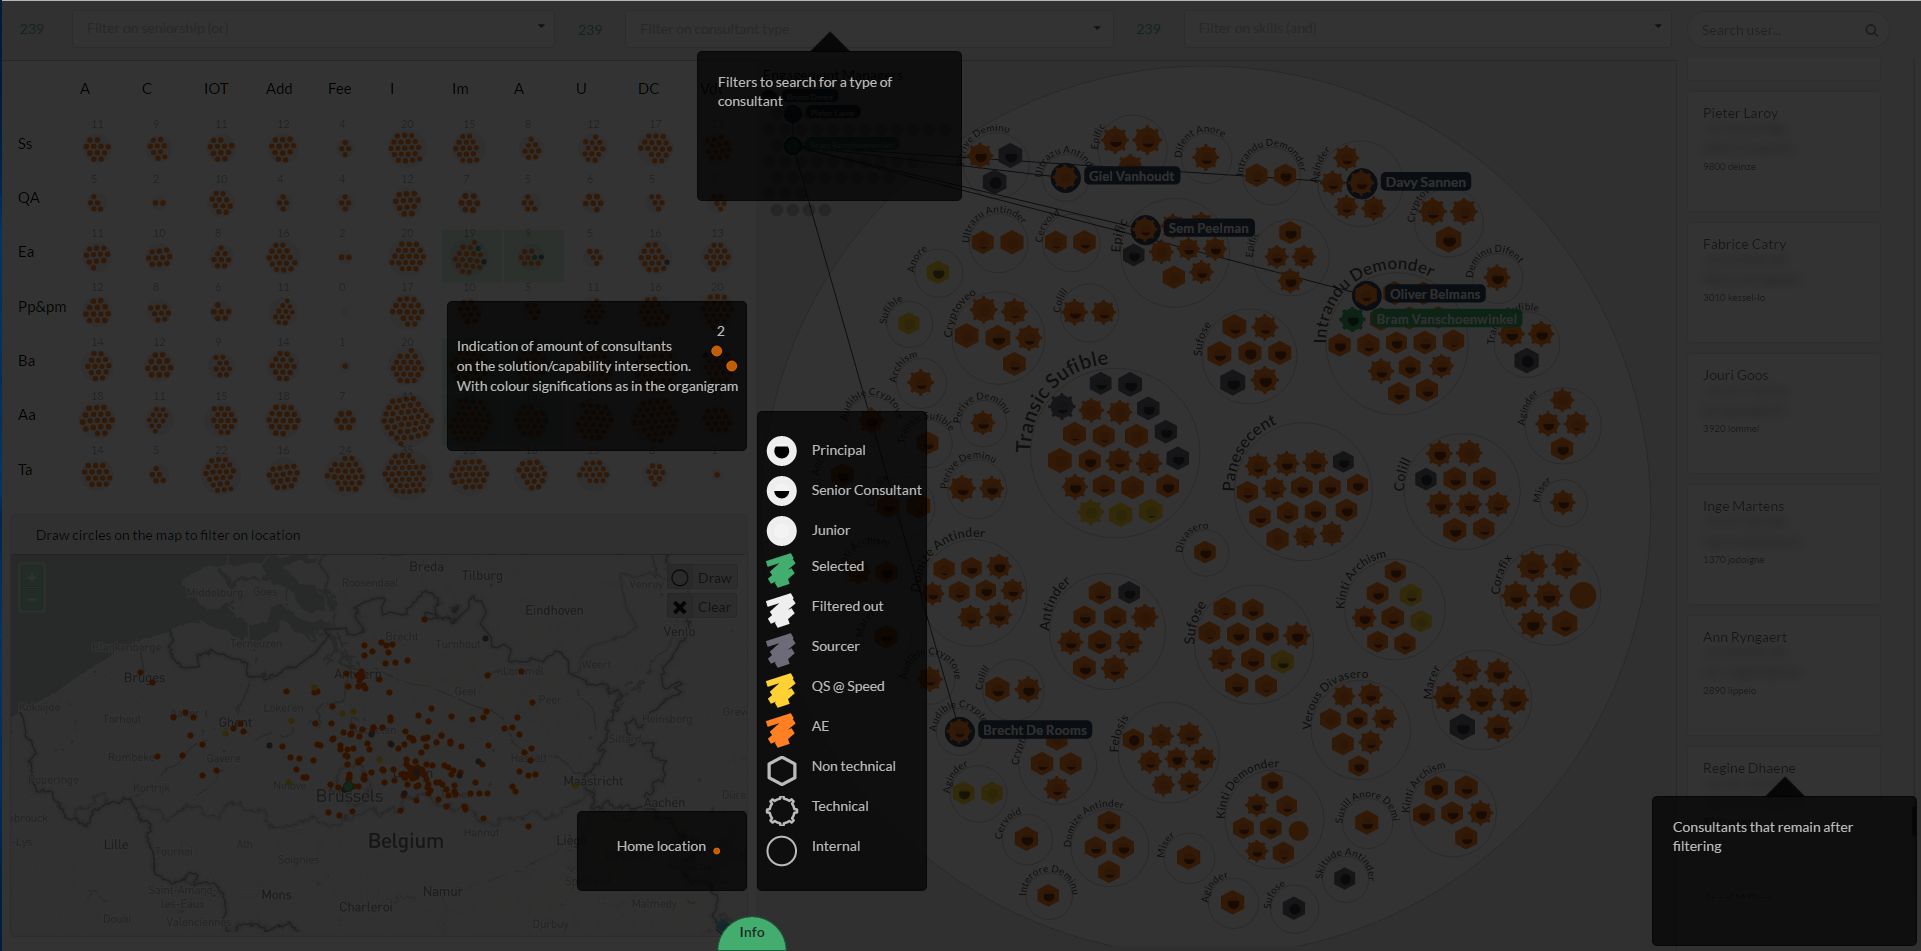
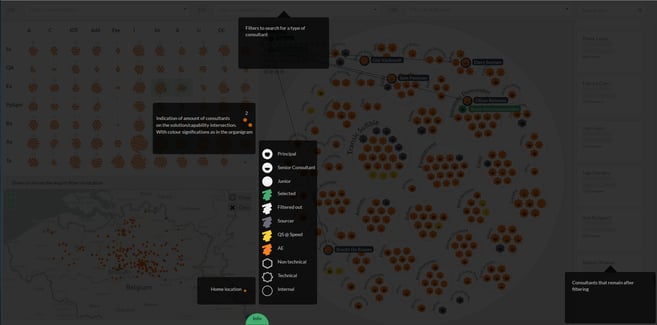
Custom resource allocation visualization
This visualization is a powerful tool for our resource allocation team at AE. It answers a wide range of questions such as:
Which consultants are active in the Application Architecture capability, live at max. 27km from Leuven, are at least a senior consultant level 2 and posses the skills UML and Functional Analysis? This example is shown in the first screenshot (note: client names are randomly generated).
Which consultants work for client X and how many of them are technical?
Do we have a good mix of seniors/juniors on our team for a specific client?
How far do our consultants have to drive in our team to get to a specific client?
It is clear how this tool makes it easier for us to find the consultant that corresponds to the requirements of a client for a certain project. It also helps us maintain a good balance within the teams.
This project is an example of a visualization that goes very far into the exploratory aspect since the resource allocation team has a wide range of tools to decide what they want to search or see.

Cockpits and dashboards
However, it does not always have to be complicated custom development. AE often writes visualizations using R packages or standard JavaScript libraries. For example, for our work at Mobile Vikings we used a combination of R packages and Shiny, which provides a good balance between results and development time. The dashboards shown below - visible to employees as well as external visitors - provides a near real-time overview of Mobile Vikings's performance that day.

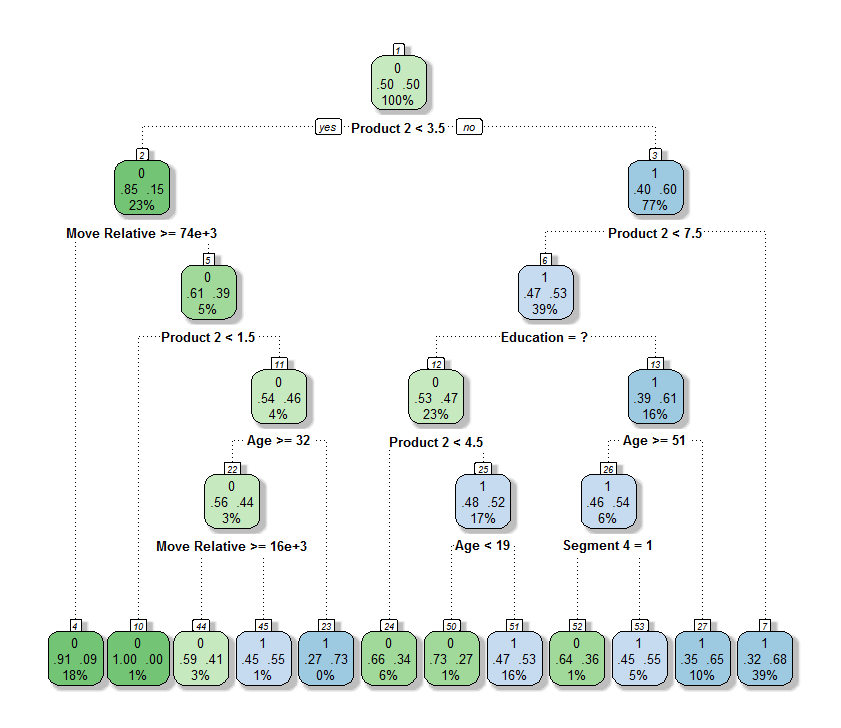
Explanatory algorithm visualizations
When building analytics algorithms, it is crucial to understand the results and to validate them with business experts. At AE we often use explanatory visualizations of algorithms in R to get a better comprehension of their results. These can typically be generated with a few lines of code.
An example can be found below: it shows a decision tree which was generated in the context of retention for a major Belgian financial institution. More context and a more detailed explanation can be found in the related blog about churn prediction: Which customers will be leaving me and what to do about it?

Process mining visualizations
Some tools can create very strong visualizations for a specific goal out-of-the-box. One example is Disco, a tool used for Process Mining. Next to other very important visualizations such as process maps, Disco can be used to generate an animated visualization of the process being analyzed.
The video below shows part of the network of a logistics company and how items are moved in this network. This type of visualization is very useful to better understand the process that is being analysed and to (visually) detect bottlenecks.
Does your company need a compelling marketing visualization or are you in need of visualizations to explain your business process or data? See what AE can do for you.