

This is the last post in a series of three about the added value of Analytics in Marketing. The first post, by my colleague Bram Vanschoenwinkel, gave an overview of a number of Analytics techniques tailored to a better understanding of your customers and their specific needs. Jessica Ruelens discussed Customer Segmentation & Profiling and a specific case for a company that sells professional training seminars in a second post. I will conclude this series with a discussion about Churn Prediction and a specific case of a bank.
Why Should I Care?
Churn is typically defined as a customer leaving the organization. However, other definitions are also possible. Consider for example the telco market: one could define a customer that has churned as a customer that has completely left the organization, a customer that reduces his/her subscriptions, a customer that has been inactive for a certain period, and so on. This definition will be different depending on your organization, but it is important to establish what it means for your organization to be a churner.
In any case, you will earn less money from this customer compared to the past, and you will need to attract an increased number of new customers. Any sales person will tell you that it is much more expensive to attract new customers than it is to retain existing customers. Studies have shown that this cost is typically about five times higher. Next to this cost, there are also other economic benefits of customer retention. Long-term customers tend to buy more, they are less costly to serve because a larger record of their specific needs and demands is available. They are also less sensitive to your competitors' marketing efforts. Positive word of mouth from happy customers is also a good way to acquire new customers: your advocates will act as a sales force multiplier. Preventing churn can thus represent an important added value.
The cost of attracting new customers is typically about five times higher than the cost of retaining existing customers.
Is There Something I Can Do About It?
Customer Retention
Customer retention programs have come a long way. In the late 18th century, American retailers started handing out copper tokens with purchases, which could be redeemed during a later purchase. To reduce costs, the copper tokens were replaced by stamps that could be collected when a certain amount was spent in a store. This method of customer retention has been popular for quite some time - and still is today. Just think about the popularity of the Frequent Flyer Programs many airlines offer to their customers. These were introduced in the early 1980's and are still used by millions of customers today.

"Gold bond stamps". Licensed under CC BY-SA 2.5 via Wikipedia.
In our Digital Era customers leave behind a digital footprint every time they surf the internet, post something on Social Media, purchase a product, and so on. This way we have a lot of data available on our customers: besides their demographics we also know their purchase history, the evolution of their invoices, how many times they contacted the help desk, ...
Analytics allows us to use smart algorithms to build models that describe the complex patterns underlying this data. These models lead us to new insights in our customers and accurate predictions about their future actions. One way of exploiting these insights is Customer Segmentation & Profiling using Descriptive Analytics algorithms, as discussed in the previous post in this series. Another interesting way is using Predictive Analytics algorithms to do Churn Prediction - which is the topic of this blog.
Churn Prediction
Customer retention efforts should be focused on those customers that will likely leave your organization. This is exactly what we do in Churn Prediction: building statistical models which estimate churn scores for customers, indicating the likelihood that these customers will churn. Knowing which customers will likely churn is however not enough; you also need to know why these customers would leave you. This requires a deep understanding of your customers and their behavior.
Churn Prediction algorithms are able to provide you with this information, based on the data you gather about your customers and their behavior. Using these insights, you will be able approach the right customers in the right way; with the right proposal; using the right channel at the right time. Studies have shown that such a personalized approach for a well-targeted group of customers is much more effective than one-way mass communication.
It is also important to consider the value these customers have for your organization. It is usually not worth to invest a lot of effort in low-value customers, especially in subscription-based sectors like telco or utilities. This value is often expressed in terms of CLV (Customer Lifetime Value), which is a prediction of the expected profit to be obtained from the entire future relationship with a customer. The calculation of this value can vary, ranging from crude computations or heuristics to highly sophisticated Predictive Analytics techniques.
How Do I Start?
Developing Analytics models is an iterative and incremental process. Typically, we start from a simple base (e.g. apply one algorithm to one data source), evaluate the quality of the obtained model and interpret the results. This is done statistically as well as in business terms, together with business experts. Based on these results more complexity is added to the model in order to refine the results (e.g. more data sources or new algorithms / combinations of algorithms). Typically several iterations are needed, each time leveraging the results from the previous steps.
Churn Prediction is a typical example of this iterative and incremental approach, even after a first good model has been obtained. When the potential churners are identified, together with their reasons for leaving the organization, you will start acting on this and try to retain these customers. If you do a good job at acting on these factors related to churn, the customers will stay with your organization. This, however, will invalidate the current Churn Prediction model. A new iteration of the Churn Prediction model will be required in order to identify the new most important factors related to churn, which will allow the next customer retention actions to be set up. This process can and should be repeated several times.
Your current Churn Prediction model will become obsolete if you do a good job at acting on the factors related to churn.
Banking Case
In the last part of this post, I will show the results of a Churn Prediction model for a bank. The goal was to identify customers that are likely to churn, based on demographic and behavioristic variables describing the customers. For this task, a churner is defined as a customer having less products with the bank within the next 3 months. There are many ways a customer can have less products with the bank: he/she can close an account, cancel a credit card, cancel an insurance product, etc. In this case, all products are considered to be equal and it is the number of products which is used to define churn.
We start be defining the CAR (Customer Analytics Record), consisting of a number of variables characterizing the customers, as explained in the first post. In this case, a combination of demographic and behavioral variables is used. The demographic variables include the customer's gender, age, education level, and some variables indicating customer segments used specifically within the bank. The behavioral variables include the time the customer has been with the bank, the customer's total balance, the number of products he/she has with the bank, characterizations of the amount of money that the customer has moved in the recent past, etc. Based on these variables, a Churn Prediction model is built that will predict whether a customer will have less products with the bank within the next 3 months.
A Decision Tree algorithm was selected as the Predictive Analytics algorithm for this application. Decision Tree algorithms are very popular because they have been applied successfully in numerous sectors and they provide models which are interpretable. Essentially, Decision Trees automatically derive a set of if-then-else rules to classify data (in this case the data describing the customers) into classes (in this case churners vs. non-churners). The generated model can also be easily visualized in a tree format (hence the algorithm's name) in order to discuss the results with business experts. This is a very important characteristic, as we need to know why customers will be churning in order to properly address them and to try to retain them. An important note to make here is that we are not necessarily looking for the model with the best predictive accuracy. The best Churn Prediction model is the one that provides the best insights, such that further churn behavior can be prevented as well as possible.
A lot of good implementations of Decision Tree algorithms are available. I have used the open-source R implementation in the rpart package for computing the trees and the rattle package for visualizing them. The obtained results can be easily integrated into existing software, either by integrating the R functionality or by re-implementing the obtained if-then-else rules.
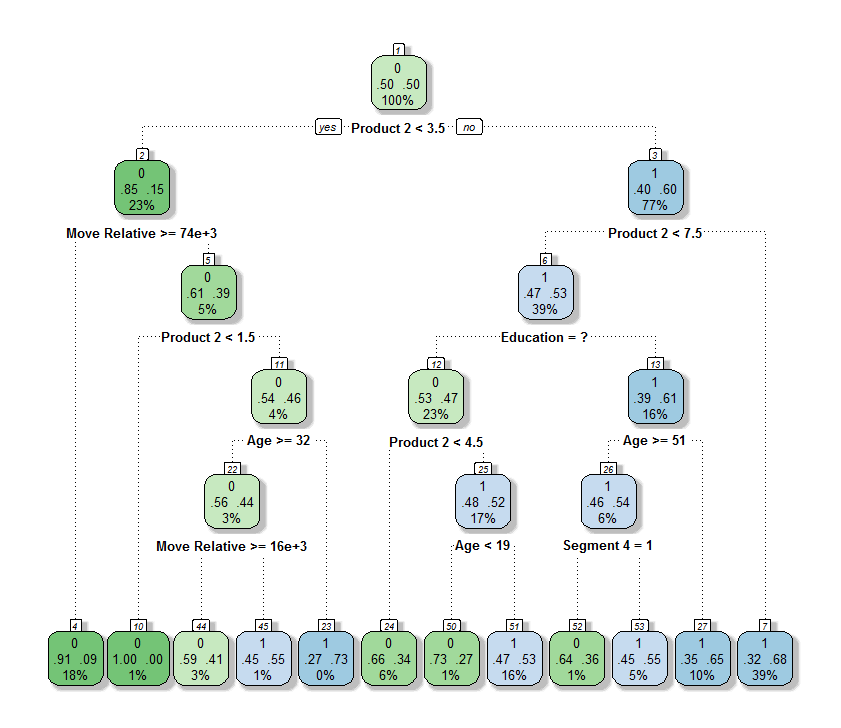
The figure above shows a Decision Tree obtained for this churn prediction task. Please note that the real tree cannot be shown here due to confidentiality reasons, and as such it should not be interpreted as a real result. The data was also partly anonymized by altering the variables' names. The tree however does illustrate some interesting characteristics of this method, which will be discussed next.
The tree is read from top to bottom by evaluating the test shown below the node and descending into the correct branch, until a leaf node is reached. The two numbers in the middle of the nodes denote the churn scores associated with a customer falling into that particular leaf. The more blue the nodes are, the more likely the customer is to churn; the more green they are, the less likely the customer is to churn. The percentages in the bottom of the nodes denote the percentage of customers that fall into that particular leaf.
Let's consider an example. Suppose a customer has a value smaller than 3.5 for Product 2. This means we need to descend from the root node (Node 1) into the left subtree, moving to Node 2. In this node we need to check variable Move Relative. Let's say the value for this variable is larger than 74000. We then again need to move into the left subtree, ending up in Node 4. This is a leaf node (a node without any path further down the tree). At this point we will make a decision. We can conclude that the churn score assigned to the customer in this example is 9%, as indicated in the leaf node we have ended up in.
Examining the Decision Tree can provide some interesting insights into which customers are churners:
- Some of the variables in the CAR are not used in the tree. This highlights another useful property of Decision Tree algorithms: they automatically select the most relevant variables to perform the task at hand and they ignore the rest. This will tell you which variables are relevant to determine the churners and which ones are not. The algorithm for instance found that the time the customer has been with the bank has no impact on the churn scores.
- Some of the variables in the CAR are used multiple times in the tree. By doing this, the algorithm effectively assigns different churn scores to different values for a particular variable. Consider for instance the variable Move Relative, which appears twice in the tree (in Node 2 and in Node 22). We can see that in general the probability of churning increases as the value of this variable decreases. Of course, there is also some interplay with other variables. Figuring these out by hand would be very difficult, but the algorithm finds them automatically for you.
- Also the absence of information can be useful. Education is for instance not known for all customers. In Node 6, this information is however used to improve the predictions of the model: if Education is not known (denoted as a question mark), the churn score in general tends to be lower.
Remind that this is not necessarily the Decision Tree with the highest predictive accuracy; it is, however, a good model which can be easily interpreted and acted upon. Adding more variables and allowing the tree to grow further will allow it to reach a higher predictive accuracy, at the cost of reduced interpretability. This would be useful in applications in which it is important to very accurately predict whether a customer will churn, but not so much why he/she would churn - e.g. as an input to a Customer Lifetime Value estimation.
Based on the predictions and insights obtained from this tree, well-targeted customer retention actions can be set up.
The best Churn Prediction model is not the one with the best statistical accuracy, but the one that provides the best insights to further prevent churn behavior.
Conclusions and Takeaways
Customer churn will decrease revenue and will require you to attract new customers. As the cost of attracting new customers is much higher than retaining your current customers, Customer Retention actions are set up to reduce churn. Churn Prediction is a Predictive Analytics technique which enables you to better focus your Customer Retention efforts and to make them more cost effective. It is typically an iterative and incremental process, as the current Churn Prediction model will become obsolete if you do a good job acting on the factors related to churn, identified by the model. It is therefore important to find the model that provides the best insights to further prevent churn behavior, not necessarily the one with the best statistical accuracy. An example of a banking case was used to illustrate this.
Some important takeaways:
- Business engagement: Involve the business early and keep them engaged throughout the entire process. Make sure they understand and believe your model or analysis. The business is a key ingredient of any Analytics project.
- Quality over quantity: Higher quality data is more important than larger amounts of data. Make sure your data is clean and up-to-date before you use it in a model or analysis!
- Think big, act small: Don't try to solve the entire problem in one shot. Start small, using a limited set of data and techniques. Quickly show the added business value. Then, iterate and incrementally add more complexity, based on the insights obtained earlier. Make sure you always keep your end goal in sight, however!
- Don't stick to text book examples: Many different approaches and techniques exist, some of which will be more suitable for your application. By experimenting, you will build up experience and develop a gut feeling for which approaches are the best in which situations. Usually a combination of different data sources and different Analytics techniques leads to the best solution.
Ready Up!
Want to learn more about other Marketing Analytics topics? Check out the previous blogs in this series on Customer Insight and Customer Segmentation & Profiling!
Want to get practical experience? We provide seminars, training sessions, in-company coaching and a lot more!
In the meantime, I look forward to any thoughts or questions you may have!


